Flourish Data Visualisations
- Client: Betfair
- Project duration: 2025 – ongoing
Flourish data visualisation tool
Flourish is a data visualisation platform from Canva allowing you to create engaging charts, maps and interactive content. By feeding in static or dynamic datasets, and picking a suitable template type (e.g. a bar chart), Flourish will output a visualisation that can be embedded on a website.
Betfair asked us to design and build Flourish data visualisations for big events – the US Election, England v India test series, Cheltenham Festival and more.
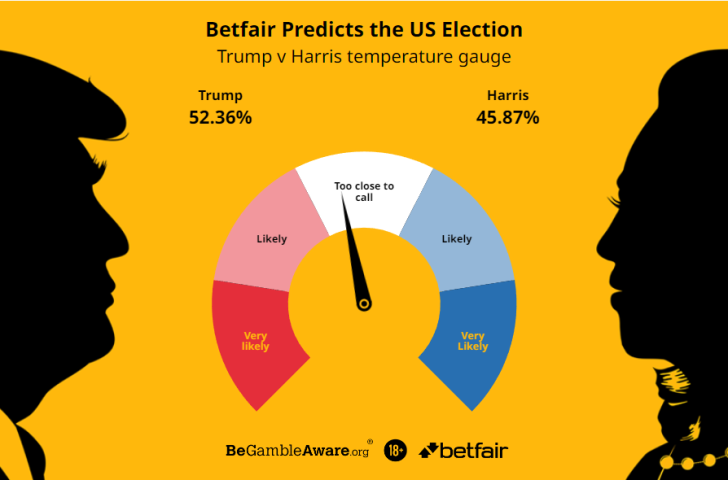
Many of the data visualisations we built for Betfair use live data sources, created by us.
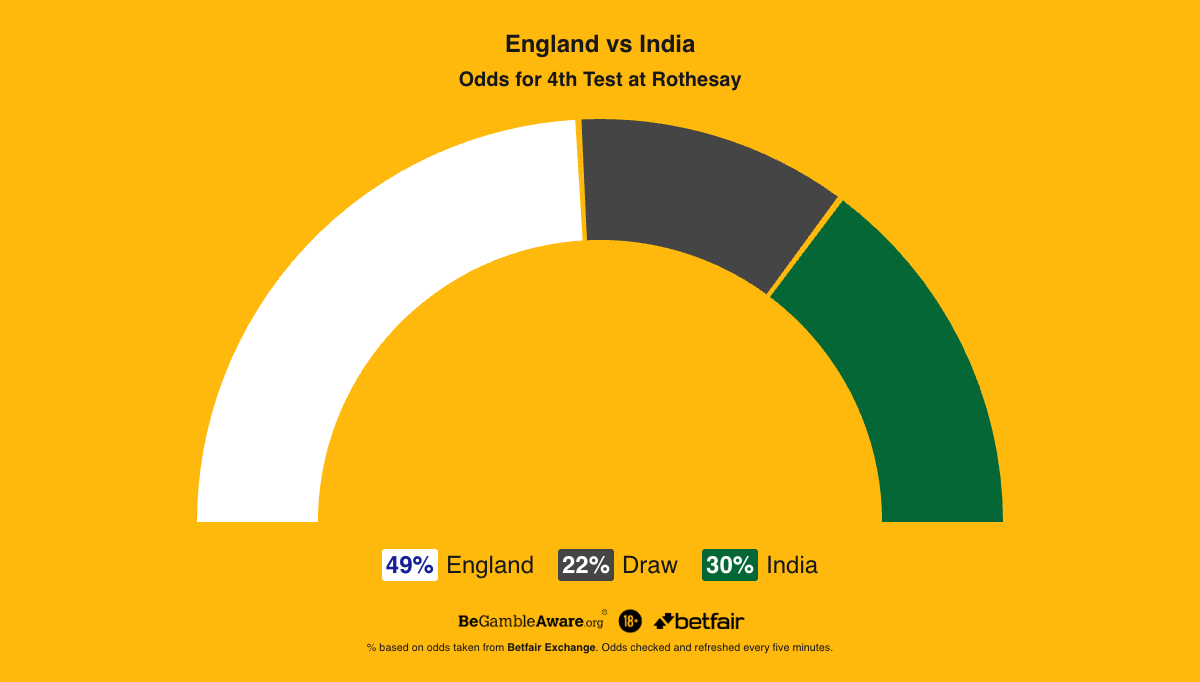
Taking the current odds on the Betfair Excahnge we work out the % chance of winning for each option. The live % chance is then available within Flourish using our own bespoke data tool.
Custom Flourish Templates
While Flourish has a wide range of different data visualisation templates with customisation options, sometimes a bespoke version is required.
We used the Flourish SDK to build bespoke templates for Betfair.
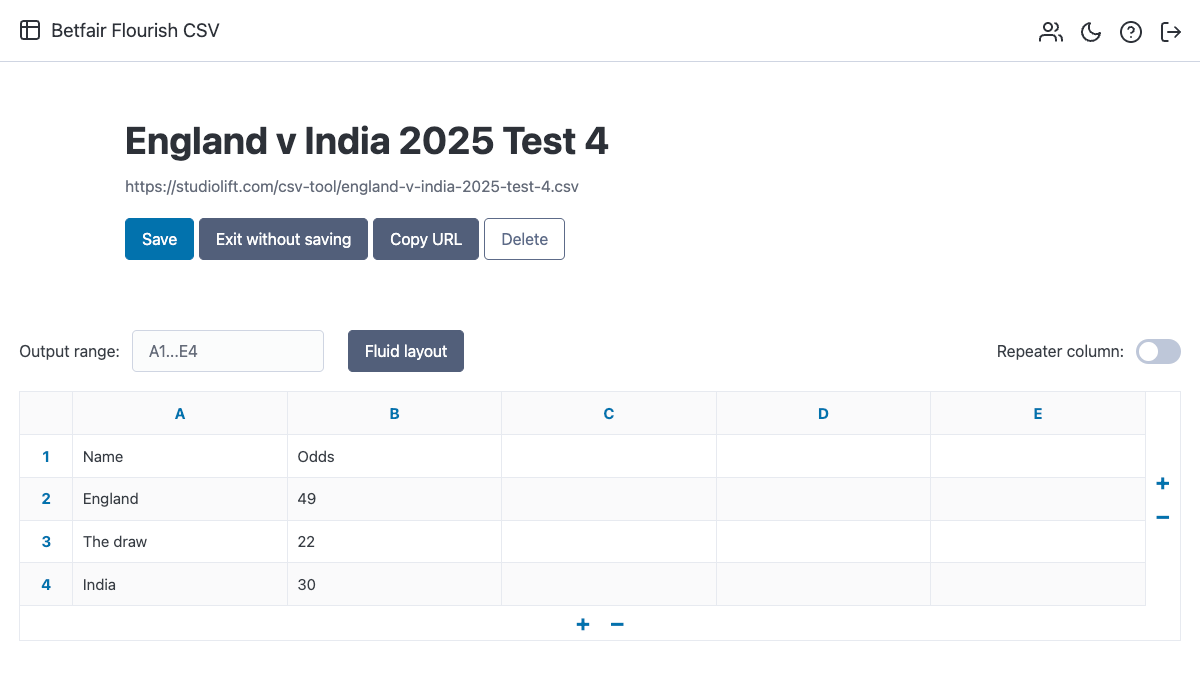
Flourish Live Data Tool
To allow for better manipulation of the live data file in Flourish, we built our own bespoke tool.
This custom tool checks live Betfair market data, allows for manipulation of the data (e.g. standard Excel style calculations), and outputs a CSV file. The CSV can be loaded into a Flourish template to drive the data visualisation.
Flourish Experts Network
We are proud members of the Flourish Experts Network. If you need any help or advice with Flourish projects, please get in touch!
See more of our infographics projects or explore other work we have done.